High good, low bad, Mead elevations 1999-2009
Posted on | January 1, 2010 | 3 Comments

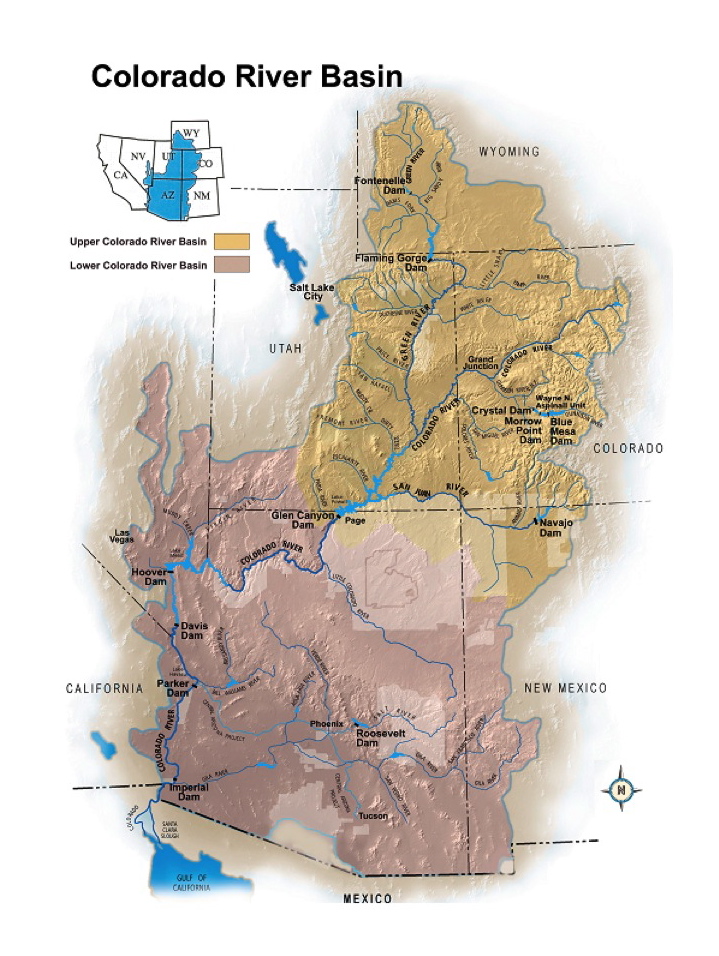
Source: federal Bureau of Reclamation. Click on the image for its 2010 operating plan for the Colorado River.
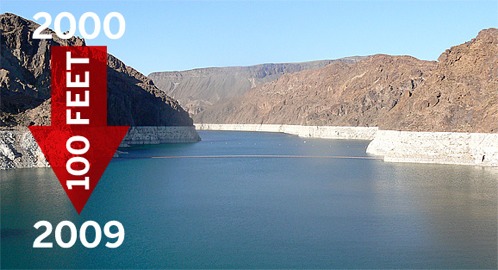
NOT everything went down during the Noughties. While federal Bureau of Reclamation records show that the elevation of Lake Mead, the major “lower basin” Colorado River reservoir serving Arizona, California and Nevada, fell more than 117 feet, the population of the US states served by Mead rose. The US Census Bureau estimates that the population of the driest state in the country, Nevada, climbed 32.3%, while Arizona’s increased 28.6% and California’s 9.1%.
If Lake Mead were a financial institution, people might, stress on might, question the logic of outgrowing one’s resources. As John Fleck of the Albuquerque Journal pointed out after reading the first version of this post, Mead is at its lowest elevation since it was first filled in the 1930s.
But the spendthrift lower basin states such as Nevada have traditionally had a back-up plan when it came to getting more water — beyond raiding their aquifers. The single most basic expectation driving unbridled growth in the lower basin states has been that the federal government would never let them run dry. Rather, southern burghers were sure that surplus Colorado River water by rights belonging to the more sparsely populated “upper basin” states of Wyoming, Colorado, New Mexico and Utah would be released south.
While unscrupulous, this attitude could be accused of logic in the days of upper basin surpluses. Except, suddenly, nature wouldn’t play. The Colorado River entered a persistent drought in 1999. Even if nature hadn’t rebelled, northerners had no plans to cooperate with the Plan B of the lower basin states. Upper basin states have developers and fertile families too. The Noughties upper basin growth award goes to Utah, the second driest state in the country, whose population increased by 24.7%, followed by Colorado with 16.8%, New Mexico with 10.5% and Wyoming with 10.2%.

Image: "Lake Mead is drying up," May 6, 2009, Good Magazine. Click on the lake to be taken to the Good article by Mark Frauenfelder.
LAKE MEAD ELEVATIONS
December 1999: 1,213.94
December 2000: 1,196.12
December 2001: 1,177.37
December 2002: 1,152.13
December 2003: 1,139.12
December 2004: 1,130.01
December 2005: 1,137.52
December 2006: 1,128.12
December 2007: 1,114.81
December 2008: 1,110.97
December 2009: 1,096.30
1/2/2010: This post has been updated. John Fleck’s observation (see comments) has been incorporated into the text.
Tags: chance of rain > December 2009 > Emily Green > Lake Mead elevations
Comments
3 Responses to “High good, low bad, Mead elevations 1999-2009”
Leave a Reply


January 1st, 2010 @ 7:19 pm
[…] an addendum to Emily Green’s year-end look at Lake Mead (High good, low bad) I’d like to extend the analysis back a bit farther in […]
January 3rd, 2010 @ 11:05 pm
There was one year in that entire decade where the water level went up. I’m sure trouble is brewing somewhere down the road! All I can say is “mother nature bats last”.
February 27th, 2010 @ 3:30 pm
It is very sad to see. I am an avid fisherman, and I have watched entire coves dissapear. We do not have the resources to keep building here. The powers that be at the valley water authority, are only interested in lining their own pockets. Not for our wellbeing. WHAT A SHAME! They say they have to wait to start building a pipeline from snake valley to mead, untill the water level drops even further. My concern is that the state wants to develop this area, not just pump underground water. More people=less water!! Its really simple!